Earthshot Labs
2022-2023
UI/UX Design Lead
Data is essential to the conservation of the world's forests. This tedious task of measuring trees is often done by scientists and field technicians to manage forest projects and estimate biomass and carbon sequestration.
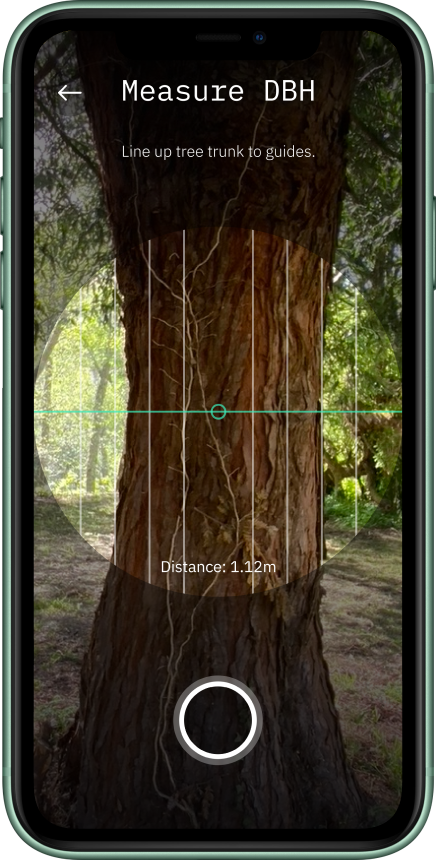
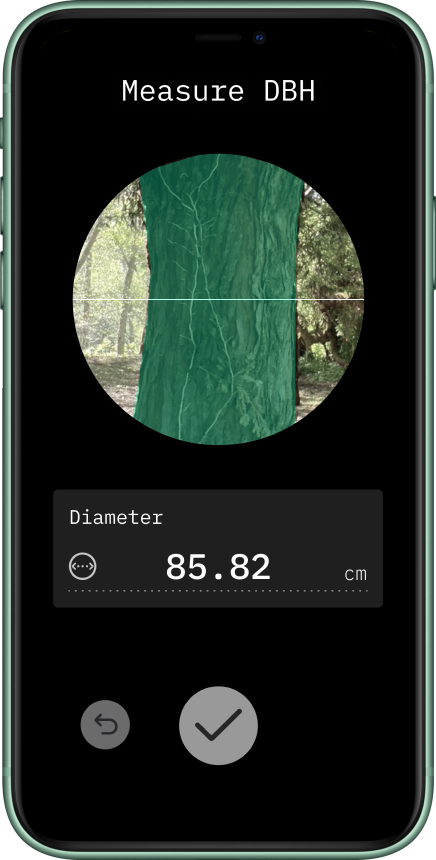
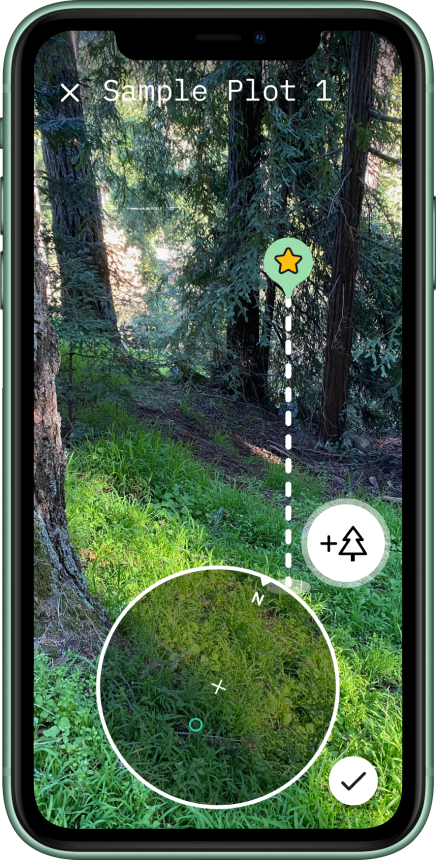
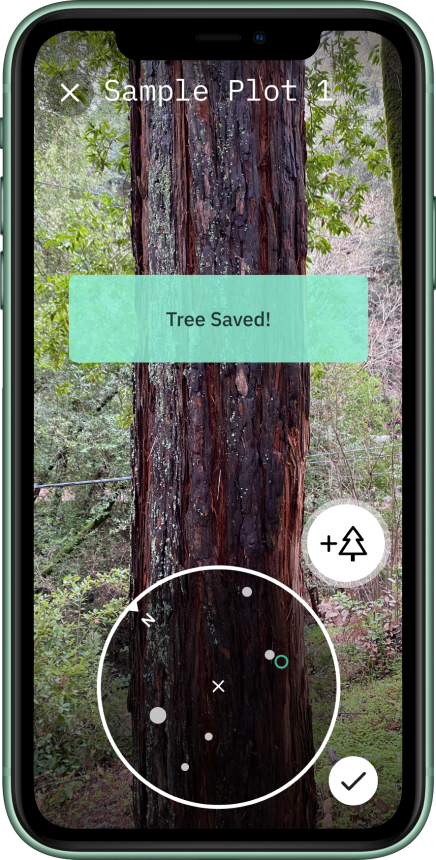
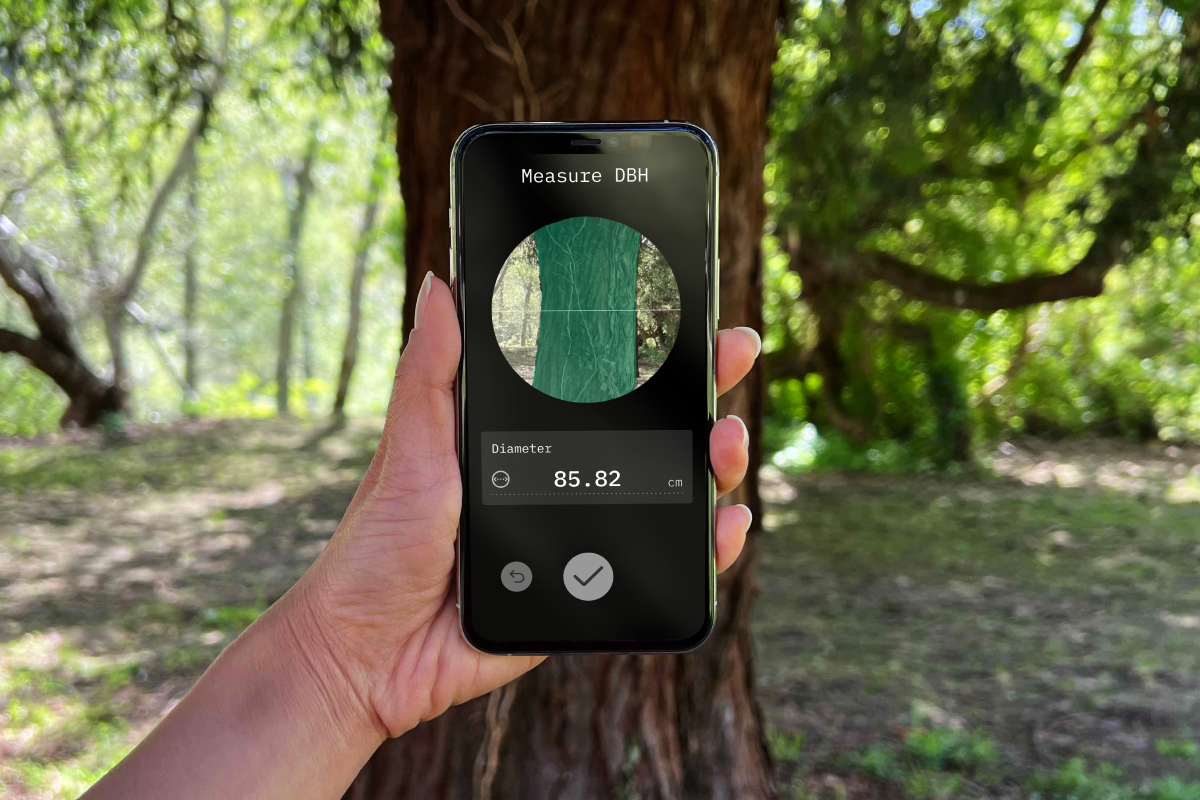
Biome is a modern app for tree inventories, using AR and ML to deliver that extra 'wow'. Our initial field test showed that using the app is 5-10x faster than conventional methods.
Earthshot Labs was awarded an NSF SBIR grant for this work.
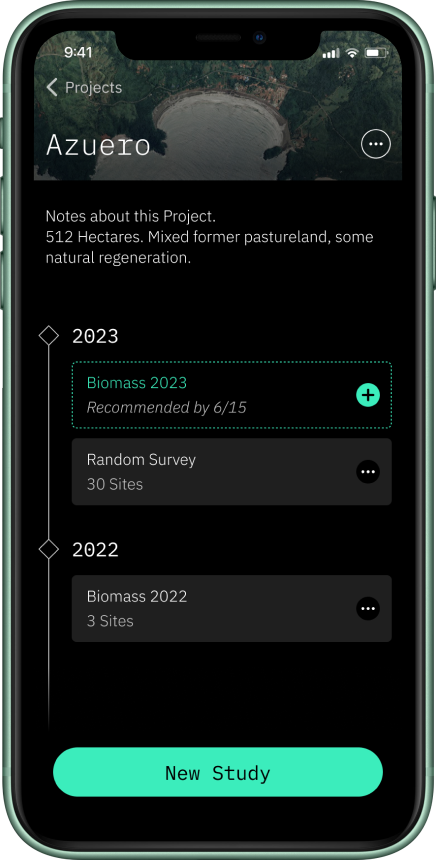
I worked with a small R&D team of 3 engineers to research user needs, design and build the first working alpha, scope future features, and run a field test in Panama.
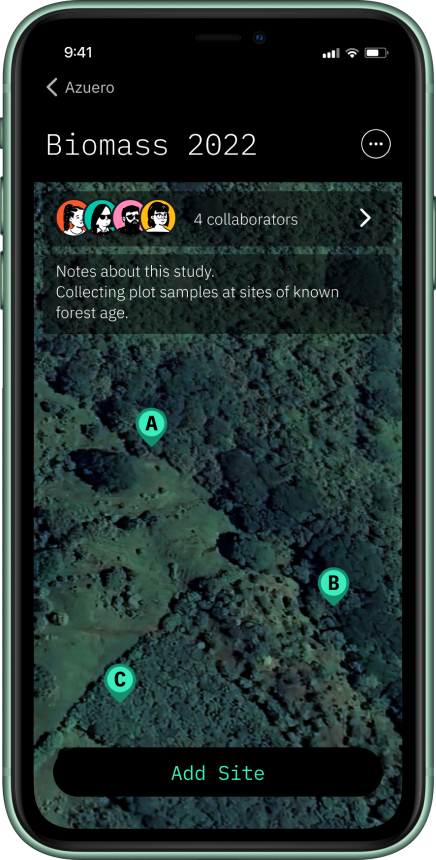
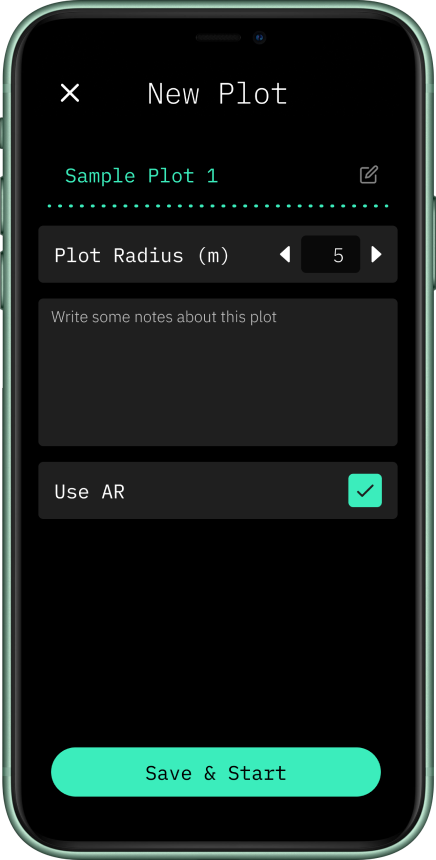
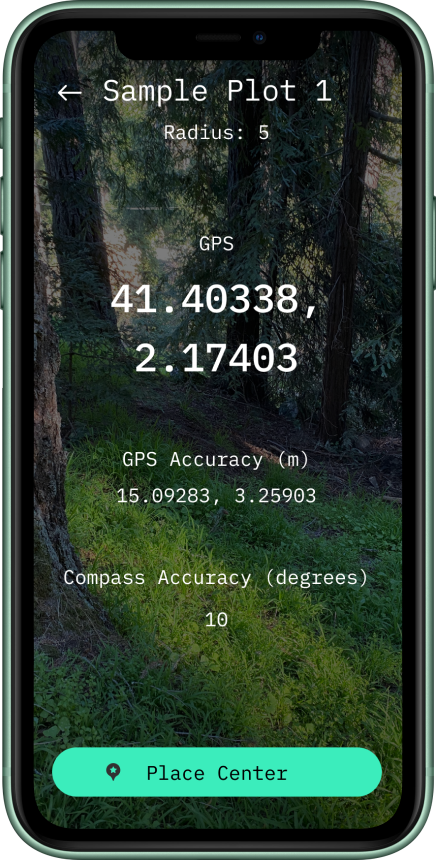
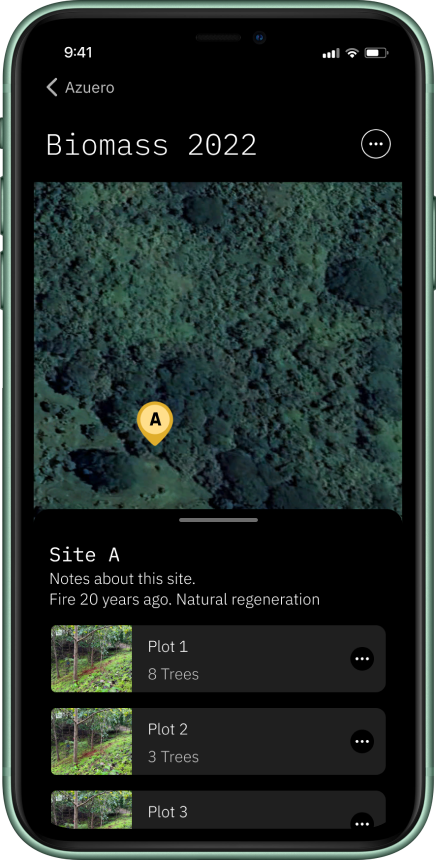
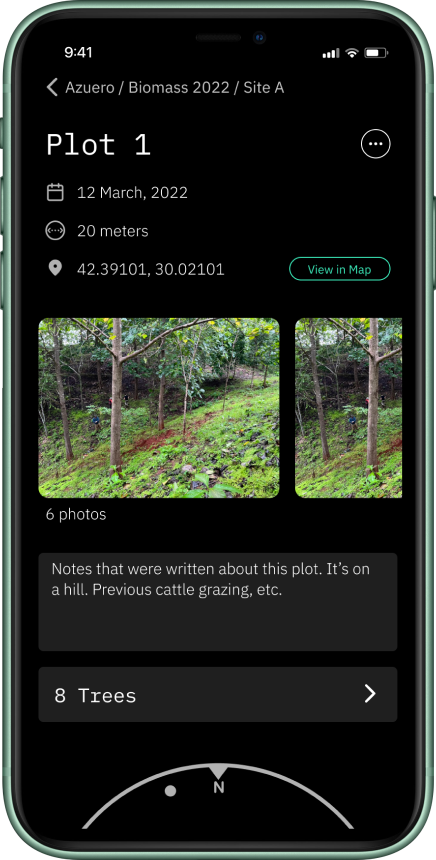
Luckily, you don't have to measure every tree. A random selection of sample plots are taken. Scientists may use a range of methodologies, but a common practice is to define a plot by a center gps location and radius.
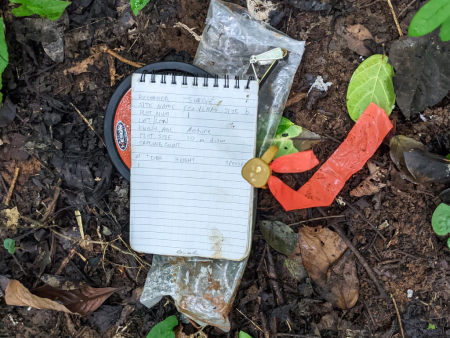
While there has been growing investment in remote sensing in the last decades, there has been little improvement in scientific field tools. Measurements are still collected with measuring tape, pencil, and notebook.
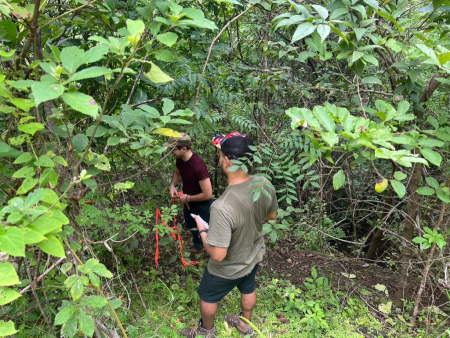
In the field, scientists are juggling these supplies while hiking down a rainforest ravine and avoiding fire ants.
And then it starts raining.
The work is gruelling and prone to inaccuracy.
Alpha test build>
This feature worked surprisingly well even for large trees. While there is a margin of error, it proved to be within the acceptable range compared to the traditional method using a clinometer.
We explored several UX flows for this feature, and the simplest version proved to be the most reliable.
Alpha test build - small tree>
Alpha test build - large tree>
Unity prototype>
While field testing, we were delighted to find that the AR circle is perfectly accurate when standing on a hillside. (Scientists usually do a bunch of trigonometry to straighten the ellipse to compensate for the slant of the hill.)
I worked on this prototype in Unity with our engineers. In Panama, I made sure to test in a variety of natural terrain. The AR tracking worked even in tall grass!
Seeing all the data collected alongside photos is powerful. Conservation projects collect loads of data, and most of it sits in folders and spreadsheets. I focused on displaying all this information very visually, making each screen layout distinct for easier browsing and giving a feeling of zooming in and out.
'Permanent monitoring plots', where the same plots are measured in subsequent years, is a common technique for tree inventories. I used this concept of time as the primary mental organization.
I talked with members of our science team to create the information heirarchy of Projects > Studies > Sites > Plots > Trees.
I made these designs as concepts. They are not an expectation for what we would ship, but rather an artifact for the team to imagine what is possible in an undefined space.